
FMCSA publishes the raw inputs to its Safety Measurement System every month: one file of roadside inspections, one file of violations, both free, both queryable over an open API. Almost nobody in transport operations looks at them in aggregate. Here is what they say.
The headline numbers
Across the current 24-month window:
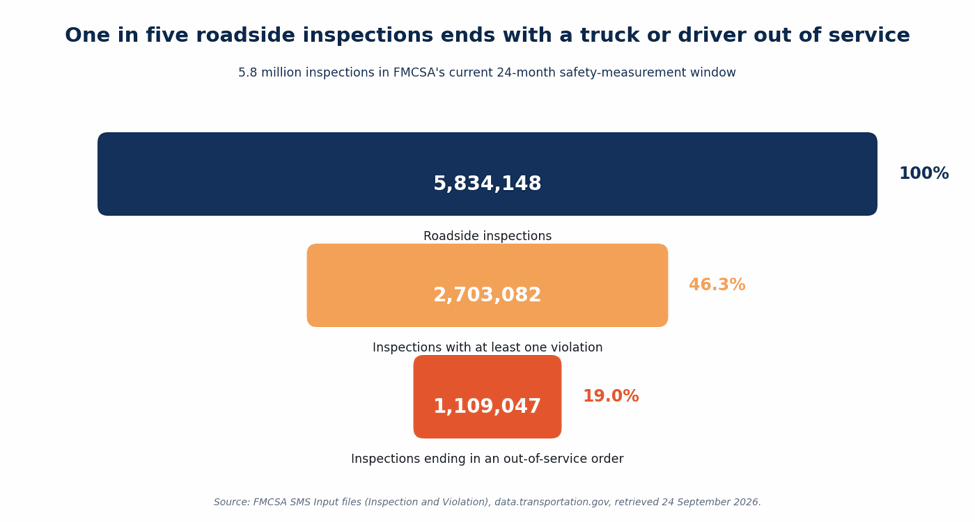
• 5,834,148 roadside inspections
• 2,703,082 (46.3%) produced at least one violation
• 1,109,047 (19.0%) ended with an out-of-service order
• 6,808,260 violations in total, of which 1,549,630 (22.8%) carried an out-of-service
Roughly one in five roadside inspections takes a truck or a driver off the road.
For a transport operation, an out-of-service order is not a safety abstraction. It is a load that stops moving, an appointment that gets missed, a recovery tractor, and a customer conversation. The interesting question is not how many happen. It is where they come from.
Three quarters of it is vehicle condition
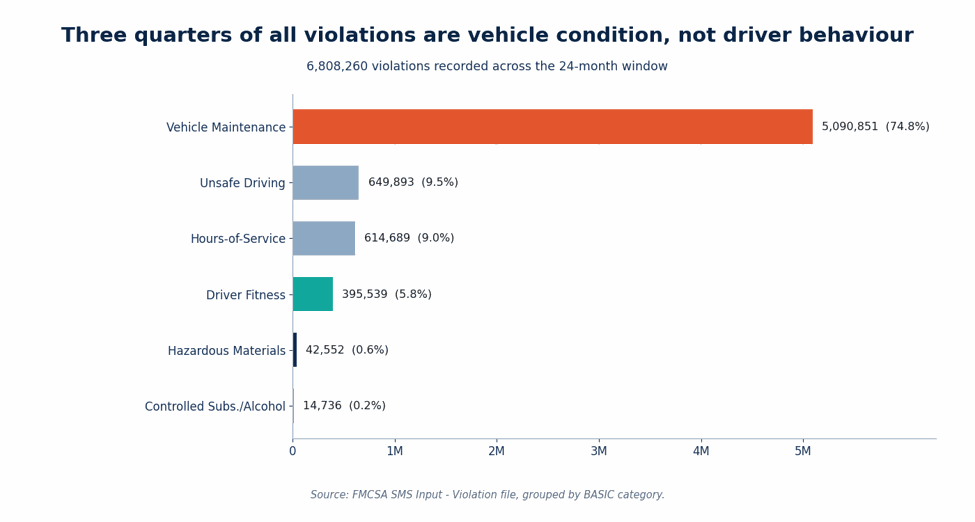
Vehicle Maintenance accounts for 5,090,851 violations, or 74.8% of everything recorded. Unsafe Driving is 9.5%, Hours-of-Service 9.0%, Driver Fitness 5.8%. Hazardous Materials and Controlled Substances together are under 1%.
That distribution is worth sitting with. The industry conversation about compliance is dominated by driver behaviour and hours. The enforcement record is dominated by equipment.
The finding that should change how you run your TMS
Split the 614,689 hours-of-service violations by what was actually wrong, and the result is not what the phrase “hours-of-service violation” suggests.
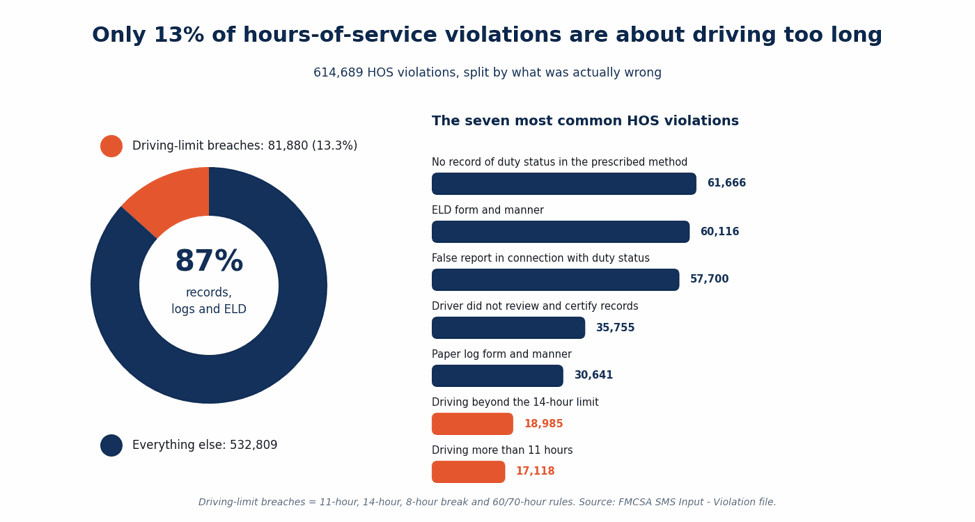
Only 81,880 violations (13.3%) are driving-limit breaches: the 11-hour rule, the 14-hour rule, the 8-hour break, the 60/70-hour limits. The other 532,809 (86.7%) are about records.
The largest single category is failing to have a record of duty status in the prescribed method (61,666). Then ELD form and manner (60,116). Then false reports in connection with duty status (57,700). Then drivers not reviewing and certifying their own records (35,755). Blank graph-grid supplies, unmounted portable ELDs, missing instruction sheets, shipping document numbers not entered.
Most hours-of-service enforcement is not catching tired drivers. It is catching bad data.
Bad data is a systems problem, and it sits squarely in the space a TMS and an ELD platform share. Certification prompts that drivers actually see, unassigned drive time reconciled daily, shipping document numbers populated from the load record instead of typed at the roadside: none of that is a driver-training issue. It is a data-flow issue between two systems that usually only exchange status pings.
And the maintenance side is a scheduling problem
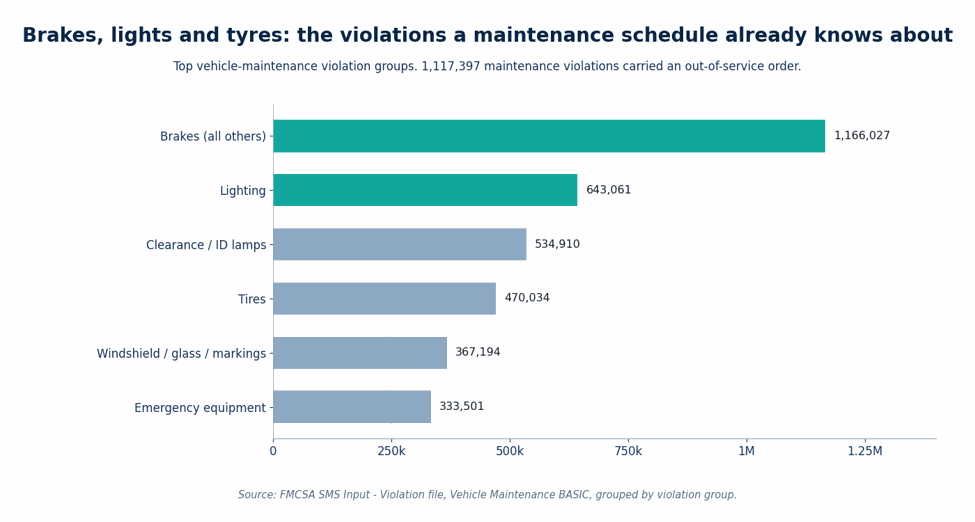
Brakes (other than out-of-adjustment) account for 1,166,027 violations. Lighting adds 643,061, clearance and identification lamps another 534,910, tyres 470,034. Of all maintenance violations, 1,117,397 carried an out-of-service order.
These are not exotic failures. They are the exact items on a pre-trip inspection sheet and a preventive-maintenance schedule. Their volume says that inspection intervals are being set by the calendar rather than by how hard a given unit is actually worked, and that driver vehicle inspection reports are not reliably closing the loop into the maintenance queue.
Mapping violations back to the system that created them
Every category above resolves to a decision made somewhere upstream, usually days before the truck reached the scale house.
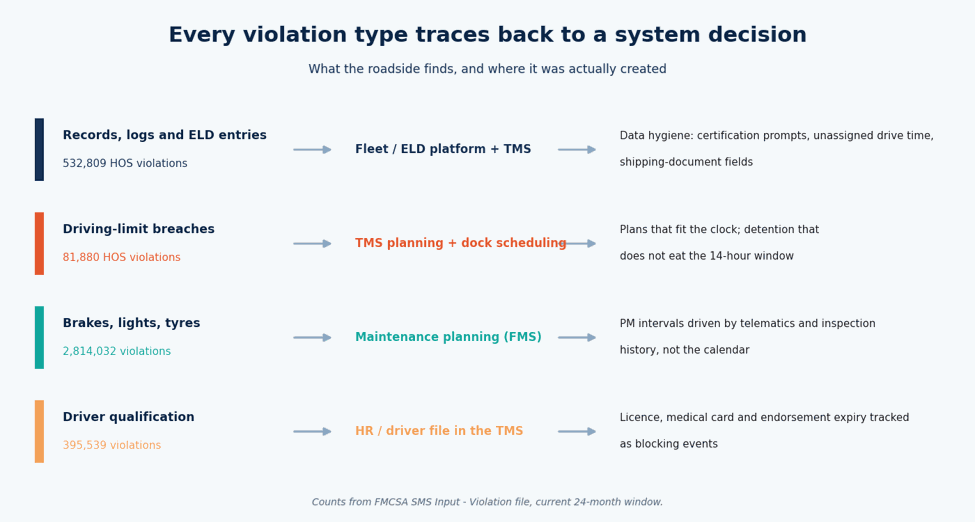
Records and ELD entries → data hygiene between TMS and ELD
Fix the join. Shipping document and trailer numbers should flow from the load record into the ELD, not be re-keyed. Unassigned drive time should be a daily exception queue with an owner. Certification should be a blocking step before a driver can be tendered the next load.
Driving-limit breaches → planning and dock scheduling
81,880 violations is the small category, but it is the one that indicts the plan. A driver only runs past the 14-hour mark if the plan assumed a dock turn that did not happen. Clock-aware planning, appointment times that the receiving site actually honours, and detention captured as data rather than as an argument are the controls here. This is also where a TMS and a WMS have to be looking at the same appointment.
Brakes, lights, tyres → maintenance planning
Move preventive-maintenance intervals onto telematics and inspection history. A unit that failed a lighting check twice in six months is telling you something the calendar is not.
Driver qualification → the driver file
395,539 Driver Fitness violations. Licence, medical certificate and endorsement expiry dates are known months in advance. They belong in the system as blocking events on assignment, not as a spreadsheet someone reviews on Fridays.
Reproduce every number here
No licence, no vendor report, no model. The FMCSA SMS input files are on data.transportation.gov and support server-side aggregation, so you never download the millions of rows:
# total inspections
curl "https://data.transportation.gov/resource/rbkj-cgst.json?\$select=count(*)"
# inspections ending in an out-of-service order
curl "https://data.transportation.gov/resource/rbkj-cgst.json\
?\$select=count(*)&\$where=oos_total!='0'"
# violations by BASIC category
curl "https://data.transportation.gov/resource/8mt8-2mdr.json\
?\$select=basic_desc,count(*)%20as%20n&\$group=basic_desc&\$order=n%20desc"
# HOS violations that are actual driving-limit breaches
curl "https://data.transportation.gov/resource/8mt8-2mdr.json\
?\$select=count(*)&\$where=basic_desc='Hours-of-Service Compliance'\
AND (lower(section_desc) like '%driving beyond%'\
OR lower(section_desc) like '%driving more than%'\
OR lower(section_desc) like '%driving limit%'\
OR lower(section_desc) like '%hours on duty%')"
Dataset IDs: `rbkj-cgst` (SMS Input — Inspection) and `8mt8–2mdr` (SMS Input — Violation). Both refresh monthly.
Honest limits
• Inspections are not a random sample. Enforcement targets carriers with poor scores, certain lanes and certain times. Rates here describe inspected trucks, not the whole fleet population.
• The window moves. These files hold the current 24-month SMS window and are rebuilt monthly, so the absolute counts will shift. The proportions are far more stable than the levels.
• Violation counts are not carrier counts. One inspection can produce many violations, and a handful of carriers can contribute a great many inspections.
• My driving-limit classification is mine, not FMCSA’s. I counted violations whose description mentions driving beyond a limit or hours on duty. A different but reasonable grouping (counting false-log violations that conceal a limit breach, for example) would raise the 13.3% figure. It would not get close to reversing the result.
• State enforcement differs. Inspection levels, priorities and citation practice vary by jurisdiction, which affects what shows up in the file.
The measurement that would settle it
The public data shows what got caught. It cannot show what it cost you, and it cannot show the upstream cause. Those live in systems most carriers and shippers already run.
Join three things and you get the number that actually justifies a TMS investment: out-of-service events per 1,000 loads by lane and by receiving site, detention minutes preceding each driving-limit violation, and the interval between a driver vehicle inspection report flagging an item and the work order closing it. If the sites that blow your appointment windows are also the sites where your drivers run out of clock, that is not a compliance story any more. It is a customer negotiation with evidence attached.
Data: FMCSA Safety Measurement System input files (Inspection and Violation), data.transportation.gov datasets rbkj-cgst and 8mt8–2mdr, queried 24 September 2026.
This article was originally published on Medium by Ponvannan P.